Not content with inventing the bar chart Willima Playfair decided to go one better and utilise the nation’s love of pies to further illustrate numerical and statistical data. Pie charts are one of the most favoured ways to display data but what if the information you want to capture is on a PDF? Have no fear PDF to Excel transfer is easily available and a good start would be clicking the link include as a start. What drove Playfair to invent the Pie chart when he could have rested on his laurels with the bar chart.
No sooner had the statistics and numerical fraternity come down from all the bar chart excitement, up pops Playfair again with the Pie Chart. This time he was carried on the shoulders of joyful statisticians around whatever institute he was working at. Probably. It had been 20 years since his bar chart idea had taken off but in his “Statistical Breviary of 1801” he really goes for it with a pie chart showing how much of Turkish Empire covers Africa, Europe and Asia. Surprisingly, it’s not as popular as the bar chart at first.
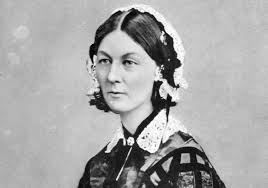
Up steps Charles Joseph Minard some 50 years later, and 30 after Playfair’s passing, and starts to use them declaring them as perfect for his work on cattle being sent to Paris to be eaten. One popular story is that Florence Nightingale invented them but this is not true. However, she did use them alot in her work

